Data Cleaner
Clean and standardize spreadsheet data.
An add-in product for Microsoft Excel that builds presentation quality histograms.
The Histogram Creator add-in for Microsoft Excel makes creating presentation quality histograms easy. It is compatible with Microsoft Excel 2010-2021 and Office 365.
The Histogram Creator comes with a help and exercise file that lets you learn quickly and easily how to use the Histogram Creator's features. The exercise file can be easily opened from the About menu or from the main menu.
The Histogram Creator is totally menu driven and very fast. It gives you full control of the bin size and step size for great looking output as illustrated by the following graph:
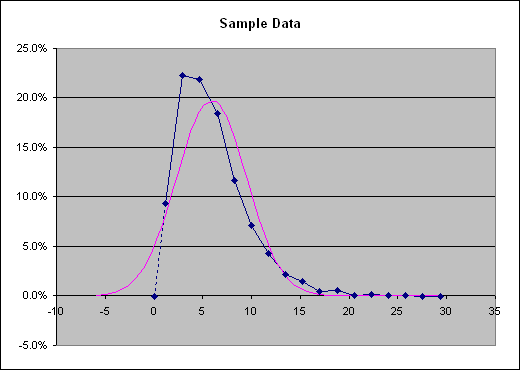
In addition to creating histograms like the one above, the Histogram Creator creates area and column histograms. It also creates cumulative frequency tables. Another feature allows you to type in any value and see what percent of the data points are less than the value and what percent is greater. The Histogram Creator easily handles error values in the data.
The Histogram Creator can not only create single histograms from a range of data, but also create multiple histograms automatically. You have the option of specifying the minimum and maximum values for the range covered by the bins and either the bin step size or the number of bins. Values outside the minimum and maximum range are captured in the additional bins that are automatically added. One of the features that assists in this process creates an initial table of the values so that you can easily modify it if necessary.
Other features of the Histogram Creator allow you to:
The first option is extremely useful if most of your data values are zero and you are trying to get the distribution of the non-zero values. The second allows you to easily exclude fliers.
Clean and standardize spreadsheet data.
Split and combine address data.