Multi-Chart Creator
Create hundreds of charts quickly and easily.
An add-in for Microsoft Excel that turns one dynamic chart into a view of hundreds of rows of data.
The Quick Chart Creator add-in for Microsoft Excel is a menu-driven add-in that lets you construct a graph of one row of data and then easily change from one row of data to another using the Quick Chart Creator toolbar. It is a great management tool for auditing performance versus goals or for viewing trends in data. It is compatible with Microsoft Excel 2010-2021 and Office 365.
With Quick Chart Creator you only have to construct one graph to graphically see many rows of data. Features in Quick Chart Creator allow you to insert trend lines and comparison lines. You can also differentiate the points on the line — for example, the first set of data on a row may represent actual results and the second set future projections. You can even have the trend line apply only to the actual data points. Quick Chart Creator is great for anyone who wants to see their data graphically.
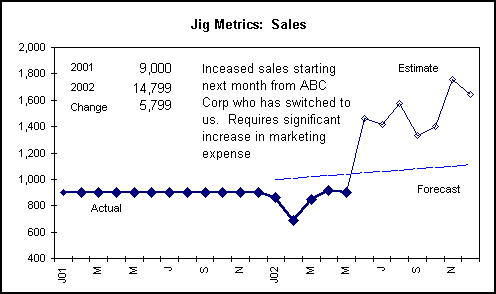
In the above graph the solid dots represent known values and the non-solid dots are estimates. (Quick Chart Creator asks you if you wish to differentiate data points and displays them in this fashion.) The light blue line is a forecast (goal) of sales. The table of numbers in the upper left is updated whenever a new set of data is graphed using the buttons on the toolbar. The comment is also updated to reflect the comment (optional) for the data being graphed. The comments can be edited on the fly — without leaving the graph — via buttons on the Quick Chart Creator toolbar.
Now construct just one chart, and by clicking the up and down buttons you can change from one data row to another. Or jump to any row or worksheet to show different data. Review hundreds of rows of data in seconds and dynamically focus on what is important at the time, versus looking for a chart you may not have created!
Create hundreds of charts quickly and easily.