Bubble Chart Creator
Quickly and easily create bubble charts from data tables.
An add-in for Microsoft Excel that makes it easy to create box and whisker plots.
The Box and Whisker Plot Creator add-in for Microsoft Excel makes it easy to create box and whisker plots. It is compatible with Microsoft Excel 2013-2024 and Office 365.
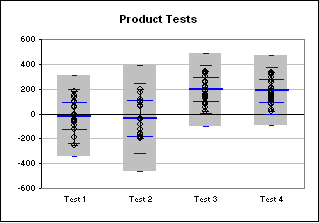
The following illustrates such charts created by the Box and Whisker Plot Creator. The charts may be horizontal or vertical:
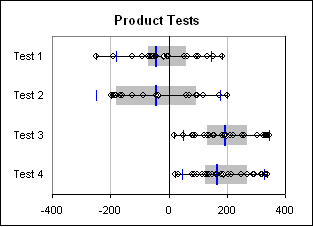
The first box and whisker plot above is a quartile plot. The gray area is where one expects 50% of the points to be. The points outside of the gray to the left represents the first quartile, or 25% of the points. The points outside and to the right represents the remaining 25%. The center blue bar is the median. The average is plotted as a white diamond. The smaller blue bars are the 1.5 sigma points.
The second box and whisker plot is a statistical plot. The gray area in this case is the 3 sigma range. One can set the range to be 1, 2, or 3 sigma. The center blue bar in the second box and whisker plot is the average (as it is a statistical plot). The three smaller sets of blue bars represent the 1, 2, and 3 sigma points.
On both plots one can:
One can also create a percentile box and whisker plot. This is like the quartile box and whisker plot, except one can set the percentile for the gray area from 0% to 100%. So, if one wanted to show where 90% of the points appear, one would use this versus the quartile style box and whisker plot.
With the Box and Whisker Plot Creator, one can:
Quickly and easily create bubble charts from data tables.
Create cascade charts that help you explain your data.
Easily create sensitivity or tornado charts.
Compare quantity or volume to unit rates such as price/unit or profit per unit.