Bubble Chart Creator
Quickly and easily create bubble charts from data tables.
An add-in for Microsoft Excel that makes it easy to create waterfall charts.
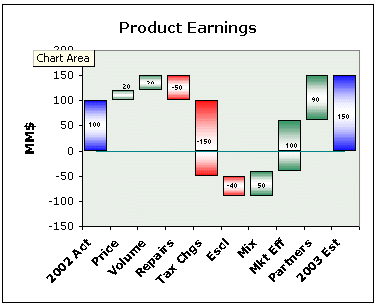
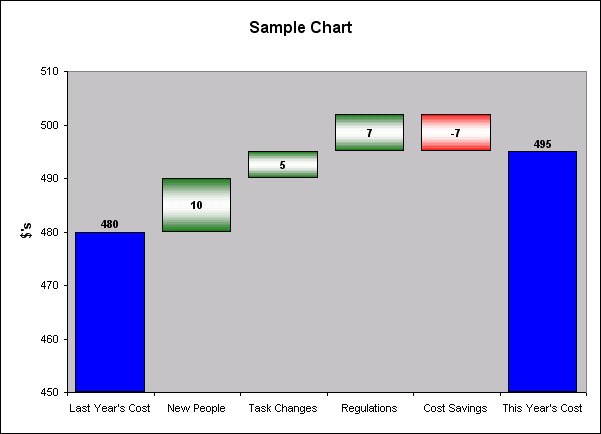
The Waterfall Chart Creator add-in for Microsoft Excel allows you to create waterfall charts. It is compatible with Microsoft Excel 2010-2021 and Office 365. The Waterfall Chart Creator is totally menu driven.
On a waterfall chart the height of the red and green boxes represents the amount of change due to an explanation which is listed below the box on the X axis. The value of the boxes can be shown in the middle, at the top, or at the bottom of the box. Such charts are an excellent way to explain change. More information on waterfall charts.
You can plot as many data points as you want, and you can delete points if you don't need them. You can have multiple total values in a chart, not just totals at the end points. And if you do not plot the totals you can create a brickyard style waterfall chart.
The formatting and other options menus allow you to specify colors, solid or gradient fill, show values and position, and many other options.
You may send waterfall charts you create with the Waterfall Chart Creator to others. They do not need the Waterfall Chart Creator add-in to view the charts.
Quickly and easily create bubble charts from data tables.
Create charts that show three dimensions of data.
Easily create sensitivity or tornado charts.
Compare quantity or volume to unit rates such as price/unit or profit per unit.