Bubble Chart Creator
Quickly and easily create bubble charts from data tables.
An add-in for Microsoft Excel that creates area and bar Mekko (Marimekko) charts.
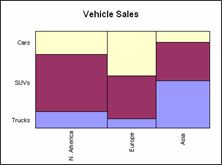
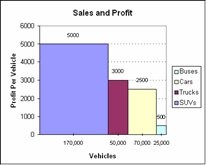
The Mekko Chart Creator add-in for Microsoft Excel makes it easy to create Mekko charts that show data in three dimensions. It is compatible with Microsoft Excel 2010-2021 and Office 365.
Such a graph allows one to see both differences in market share by product type and region, and the overall size of the different markets. One can insert values, labels, or both on individual data points or on the top or right side, in addition to the X and Y labels on the left and bottom.
One can easily manually change any data point's label, and remove labels. There are options to insert a label only if the % down and % across meet minimum values, which allows ease of automatic labeling of major data points.
Quickly and easily create bubble charts from data tables.
Create cascade charts that help you explain your data.
Easily create sensitivity or tornado charts.
Compare quantity or volume to unit rates such as price/unit or profit per unit.